Surviving to sexual maturity and being able to contribute to the gene pool define fitness for an individual. Collectively, those surviving individuals determine the survival of the population. For a management regime to ensure, in the face of exploitation, that a sufficient number of juveniles reach maturity usually requires information on the size and age at first maturation.
Sexual maturation has been known to be associated with physiological and behavioral changes, the latter being sometimes manifested in the form of breeding aggregation, migration and territoriality. The relationship between these biological changes and growth, mortality and longevity has been studied by Alm (1959), Beverton and Holt (1959) and Pauly (1984), among others (see Box 30). Using data in FishBase, Froese and Binohlan (2000) have likewise demonstrated that size and age at sexual maturity are strongly correlated with growth, maximum size and longevity.
Few topics seem as obvious, yet are so misunderstood, as the relationship between the growth and reproduction of fishes. The conventional wisdom, reiterated in a multitude of papers, reports and books, is that fish tend to grow fast until they reach length at first maturity, then grow more slowly "because the energy formerly used for somatic growth is now used for reproduction." This may be called the ‘reproductive drain’ hypothesis.
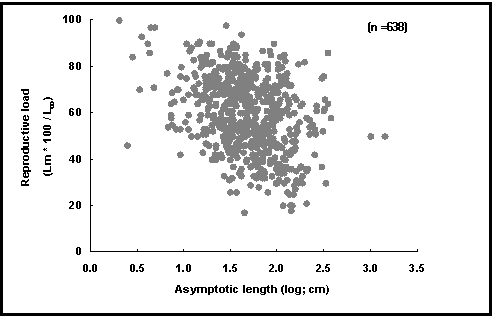
Obvious as it may seem, this hypothesis is probably wrong and an alternative has been proposed: it is the slowing down of the growth process which triggers off maturation, not maturation and spawning which stop growth (Iles 1974; Koch and Wieser 1983; Pauly 1984; Thorpe 1987). Also, because of the strong positive allometry with which the gills of fish grow which are capable of reaching large sizes, their body growth can continue well beyond Lm; thus, they have low reproductive loads Lm/L¥
(Pauly 1984).
To evaluate competing hypotheses such as these, one can examine their corollaries, i.e., the predictions that follow from them. Many small fish are known to quickly grow to a size close to L¥
, then spawn and reduce their growth drastically. In contrast, large fishes tend to approach L¥
only gradually, with a slight reduction in growth starting near ½ L¥
, when they start spawning. This generates the descending trend of our plot of reproductive load vs. asymptotic length (see Fig. 43), which thus corroborates the second of the above hypotheses. The reproductive drain hypothesis, on the other hand, cannot explain a graph such as presented here, and its interpretation would thus require another ad hoc hypothesis.
References
Iles, D. 1974. The tactics and strategy of growth in fishes, p. 331-345. In F.R. Harden Jones (ed.) Sea fisheries research. Elek Science, London.
Koch, F. and W. Wieser. 1983. Partitioning of energy in fish: can reduction in swimming activity compensate for the cost of production? J. Exp. Biol. 107:141-146.
Pauly, D. 1984. A mechanism for the juvenile-to-adult transition in fishes. J. Cons. CIEM 41:280-284.
Thorpe, J.E. 1987. Smolting versus residency: developmental conflict in salmonids. Am. Fish. Soc. Symp. 1:244-252.
Daniel Pauly

Fig. 43. Reproductive load for various fishes. Note descending trend (see Box 30 and Fig. 44 for interpretation)
There are maturity records for over 1,300 species from about 1,000 references
The MATURITY table contains information on length and age at first sexual maturity for over 1,300 species (over 3,000 records), from about 1,000 references. Among the major sources of information are Beverton and Holt (1959), Compagno (1984a, 1984b), Dorel (1985), García-Cagide et al. (1994), Kailola et al. (1993), Kromer (1994), Last and Stevens (1994), Lévêque (1997) and van der Elst and Adkin (1991).
In the literature, information on sexual maturity comes in various, closely related categories:
the median or mean length or age, i.e., the length or age at which 50% of the population become mature for the first time;
the length or age at which a certain percentage (but not 50%) of the population become mature;
the length or age of the smallest mature fish;
the length or age of the largest fish maturing for the first time;
as a range of the length or age of smallest (youngest) to the largest (oldest) mature fish (3 and 4);
as a range of the mean length or age at maturity; and
unqualified values.
Initially, this table included only information pertaining to the median or mean length or age (category 1). Such value is usually derived through linear interpolation, probit analysis, fitting of a logistic curve, or otherwise estimated from a plot of percent mature over the length or age. In most cases, though, the method used is not mentioned. Later the table was modified to accommodate the variety of existing information.
The first category of information is entered in the Lm or tm fields, whereas the Range fields accommodate information of categories 2-7. Unqualified values (category 7) were entered as minimum value in the Range fields. In some cases, the Comment field provides details on a value that has been entered.
To verify the lengths at first maturity (Lm), we checked whether the corresponding ratio L¥ /Lm remained within the range known to occur in fishes (Beverton and Holt 1959).

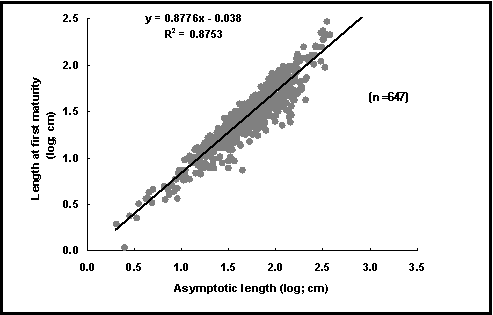
Fig. 44. Length at first maturity vs. asymptotic length. Same data as in Fig. 43, but shown as plot of logLm vs.
logL¥
. While close, the relationship is not strictly proportional: Lm increases in proportion to a power of L¥
of less
than unity (i.e., 0.9), which is why the reproductive load in Fig. 43 declines with L¥
.
You get to the MATURITY table by clicking on the Biology button in the SPECIES window, the Reproduction button in the BIOLOGY window and the Maturity button in the REPRODUCTION AND EARLY STAGES window. You get to the Maturity Report by clicking on the Reports button in the Main Menu, the Population Dynamics by Family button in the PREDEFINED REPORTS window, and the Maturity Information button in the next window.
On the Internet, you get to the MATURITY table by clicking on the Maturity link in the ‘More information’ section of the ‘Species Summary’ page. The Key Facts link in the same section estimates length at first maturity from an empirical relationship for all species for which the maximum length is known. You can generate a list of all species with available data by selecting the Maturity button in the ‘Information by Topic’ section of the ‘Search FishBase’ page. In the ‘Information by Family’ section of that page, you can select a family, select the Graphs radio button, and then create several graphs relating to length at first maturity.
Alm, G. 1959. Connection between maturity, size, and age in fishes. Inst. Freshwat. Res. Rep. No. 40, 145 p.
Beverton, R.J.H. and S.J. Holt. 1959. A review of the lifespans and mortality rates of fish in nature, and their relation to growth and other physiological characteristics, p. 142-180. In G.E. Wolstenholme and M. O’Connor (eds.) CIBA Foundation Colloquia on Ageing. Vol. 5. The lifespan of animals. J. and A. Churchill, Ltd., London. 344 p.
Compagno, L.J.V. 1984a. FAO species catalogue. Vol. 4. Sharks of the world. An annotated and illustrated catalogue of shark species known to date. Part 2. Carchariniformes. FAO Fish. Synop. 4(125)Pt. 2, 655 p.
Compagno, L.J.V. 1984b. FAO species catalogue. Vol. 4. Sharks of the world. An annotated and illustrated catalogue of shark species known to date. Part 1. Hexanchiformes to Lemniformes. FAO Fish. Synop. 4(125) Pt. 1, 249 p.
Dorel, D. 1985. Poissons de l’Atlantique nord-est relations taille-poids. Institut Français de Recherche pour l’Exploitation de la Mer.
Froese, R. and C. Binohlan. 2000. Empirical relationships to estimate asymptotic length, length at first maturity and length at maximum yield per recruit in fishes, with a simple method to evaluate length frequency data. J. Fish Biol. 56:758-773.
García-Cagide, A., R. Claro and B.V. Koshelev. 1994. Reproducción, p. 187-262. In R. Claro (ed.) Ecología de los peces marinos de Cuba. Inst. Oceanol. Acad. Cienc. Cuba.
Kailola, P.J., M.J. Williams, P.C. Stewart, R.E. Reichelt, A. McNee and C. Grieve. 1993. Australian fisheries resources. Bureau of Resource Sciences, Canberra, Australia. 422 p.
Kromer, J.-L. 1994. Rio Grande de Buba: Bio-ecologie et parameters environnementaux. UICN/Ministere des peches de Guinee-Bissau. 119 p.
Last, P.R. and J.D. Stevens. 1994. Sharks and rays of Australia. CSIRO, Australia. 513 p.
Lévêque, C.L. 1997. Biodiversity dynamics and conservation: the freshwater fish of tropical Africa. ORSTOM. Cambridge University Press, UK. 438 p.
Pauly, D. 1984. A mechanism for the juvenile-to-adults transition in fishes. J. Cons. CIEM 41:280-284.
van der Elst, R.P. and F. Adkin, Editors. 1991. Marine linefish: priority species and research objectives in southern Africa. Oceanogr. Res. Inst. Spec. Publ. No. 1, 132 p.